Food and Grocery Cost Benchmarks for Diaspora Households
BLS Consumer Expenditure food-at-home and food-away shares, USDA planning context, and grocery bands when remittances, parent hosting, and ethnic-market shopping share one paycheck.
Key takeaways
- BLS Consumer Expenditure Survey splits food spending into food at home and food away from home with published average shares.
- Illustrative bands: 8 to 12 percent of gross for careful home cooking, 12 to 18 percent when dining out and delivery are frequent.
- Hosting parents or relatives without a grocery line is hidden support that distorts am I behind math.
- Ethnic import premiums and specialty stores are real costs, not personal failure to meal prep.
- Log food percent beside shelter, transport, and support on the Household Dashboard.
Your Instacart receipt is $186 for one week. Your mother sends a photo of the same ingredients costing half as much in her city. You host parents six weeks a year and watch the fridge bill double. Bureau of Labor Statistics Consumer Expenditure Survey data show food as one of the largest flexible spending categories for U.S. households.
Diaspora households often shop ethnic grocers with premium import prices, send grocery money abroad, and feed relatives visiting from overseas without calling it support. Food rarely gets a named line beside remittance caps even though it competes with retirement every month.
This guide maps food and grocery burden benchmarks—not diet advice, but whether eating and sending fit beside shelter, transport, and support.
Key reminders
Hosting groceries are support
Feeding parents or relatives without a line item hides real dollars that compete with retirement.
Specialty store premiums are real
Ethnic grocery prices belong in the benchmark, not in shame about failing to shop generic only.
BLS Consumer Expenditure: food category themes
Verify current survey year tables.
| CE theme | Planning read |
|---|---|
| Food at home vs away from home split | Build two line items |
| Major flexible spending category | Room to adjust without moving |
| Shares vary by income quintile | Compare within band |
Source: U.S. Bureau of Labor Statistics, Consumer Expenditure Survey
Illustrative food percent bands (gross)
Planning lenses; swap for your receipts.
| Pattern | Typical band |
|---|---|
| Home cooking primary | 8–12% |
| Regular dining out and delivery | 12–18% |
| Heavy hosting or specialty imports | 15–22% |
Source: Generational editorial framework; BLS expenditure shares
Example: $9,500 gross household
Replace with your statements.
| Line | Monthly | % gross |
|---|---|---|
| Groceries and specialty store | $720 | 7.6% |
| Dining out and delivery | $380 | 4.0% |
| Parent hosting grocery spike (avg) | $120 | 1.3% |
| Total food | $1,220 | 12.9% |
Source: Generational editorial framework
Food plus big-three burden snapshot
Combined awareness with batch 44 guides.
| Category | Example % gross |
|---|---|
| Shelter | 33% |
| Transportation | 14% |
| Support cap | 9% |
| Food | 13% |
| Combined | 69% |
Source: Generational editorial framework; BLS expenditure themes
Quarterly checklist
Fifteen minutes each quarter.
| Step | Done? |
|---|---|
| Trailing 3-month food percent | Y/N |
| Hosting weeks noted | Y/N |
| Support cap unchanged or revised | Y/N |
| Dashboard row updated | Y/N |
Source: Generational editorial framework
What counts in a food benchmark
Include: groceries, household staples, school lunch money, coffee shops you treat as daily habit, delivery apps, and work lunches.
Include recurring grocery wires or cash you send so parents abroad can eat if that is part of your support stack.
Exclude one-off wedding catering unless you budget celebrations as a named annual line.
Food at home versus food away from home is how BLS tables usually split the category.
BLS Consumer Expenditure food shares
Bureau of Labor Statistics Consumer Expenditure Survey reports average annual food expenditures and shares of total household spending.
Food at home covers supermarket and specialty store purchases. Food away from home covers restaurants, takeout, and delivery.
National averages hide high-cost metros and undercount diaspora households buying imported goods at ethnic grocers at premium prices.
Illustrative percent-of-gross bands
Home-cooking primary, limited delivery: often 8 to 12 percent of gross for many urban dual-income households without large hosting loads.
Mixed dining out and delivery several times weekly: often 12 to 18 percent of gross.
Above 20 percent before flights and support: review delivery subscriptions, work lunch defaults, and unlogged hosting groceries.
Use gross or take-home consistently with shelter and transport benchmarks.
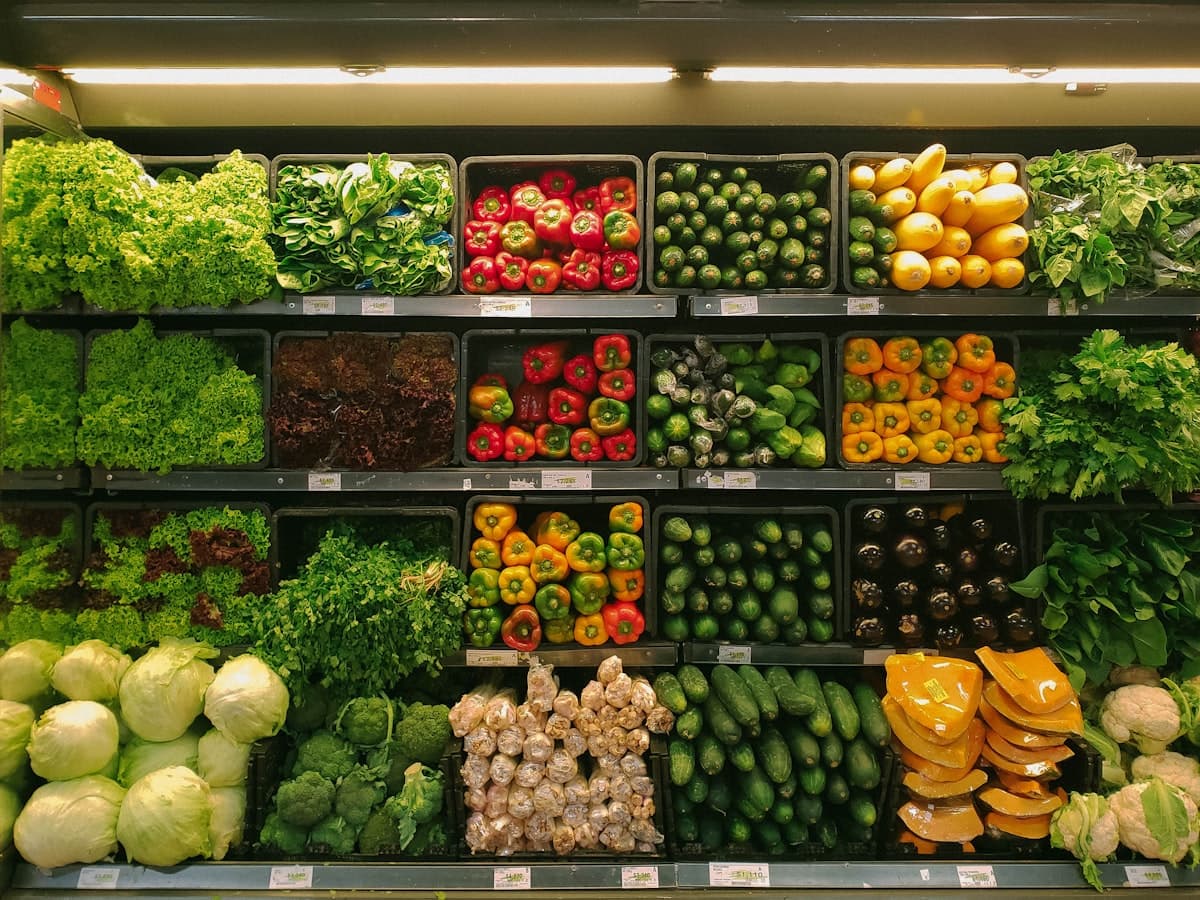
Ethnic grocery and import premiums
Specialty stores and import aisles often charge more than mainstream chains for the same cultural staples. That premium is a real budget line, not a character flaw.
Bulk buying for extended family visits can spike one month without changing your monthly average. Track trailing three-month average instead of panicking at a single receipt.
Compare unit prices when you can; keep a short list of staples you will not substitute so the budget reflects honest preferences.
Hosting parents and hidden food support
Household budgets and written agreements when parents move in should name who pays groceries when parents live with you.
If you feed parents rent-free for six weeks yearly, amortize extra grocery spend across twelve months for honest burden math.
Sibling fairness: if one child hosts and buys food while another sends cash only, food belongs in the quarterly ledger.
Food plus shelter plus transport plus support
Example: $10,000 gross, rent $3,200 (32 percent), transport $1,400 (14 percent), support cap $800 (8 percent), food $1,100 (11 percent). Big four near 65 percent before insurance and retirement.
Typical family support budgets by income helps place support beside food.
If food is 16 percent and support 14 percent, retirement deferral is often what compresses silently.
Dual-income and shift-work food patterns
Night shifts and long commutes increase convenience food and delivery even when you prefer home cooking.
Family support benchmarks for dual-income diaspora couples split obligations before one partner is blamed for DoorDash receipts.
Childcare pickup windows often collide with dinner prep; name the tradeoff instead of moralizing quick meals.
Sending food money abroad
Some households send extra remittance labeled for groceries during inflation abroad. Count it in support cap, not as invisible generosity.
Remittance budget benchmarks when you send and they also send covers two-way flows that include food top-ups.
Exchange rate moves change purchasing power abroad faster than your U.S. grocery bill.
Monthly grocery audit
First Sunday: sum last month food at home and away from home from cards and cash. Divide by chosen income base.
Note hosting weeks and crisis months separately so trends stay readable.
Use the Family Support Budget Calculator when support and groceries spike in the same month.
Quarterly food burden check
Every quarter: food percent, shelter percent, transport percent, support cap percent, emergency fund months.
Log rows on the Household Dashboard. One honest screen beats arguing about receipts from memory at holiday dinner.
Spot an error? Email hello@gogenerational.com. We correct verified mistakes promptly per our editorial policy.
Sources & further reading
Related content
Generational Take
Get the next Generational Take
Get our latest practical tips and takes in your inbox. No spam.