
Chinese Canadians own homes at high rates. One in five still lives in poverty.
StatCan’s Chinese Canada portrait shows an hourglass income story: high bachelor’s rates and ownership beside overqualification, mortgage stress, and a 19% poverty rate in 2024. Immigration waves from Hong Kong, mainland China, Taiwan, and Southeast Asia do not share one balance sheet.
On February 13, 2026, Statistics Canada released Portrait of the Chinese Populations in Canada: Diversity and Socioeconomic Outcomes, by Katherine Wall. The Daily summary put the kitchen-table finding up front: Chinese people in Canada were more likely than the non-racialized non-Indigenous population to sit in the two lowest deciles of adjusted after-tax economic family income, and also more likely to sit in the top decile. No other population group in the portrait series showed that same hourglass shape.
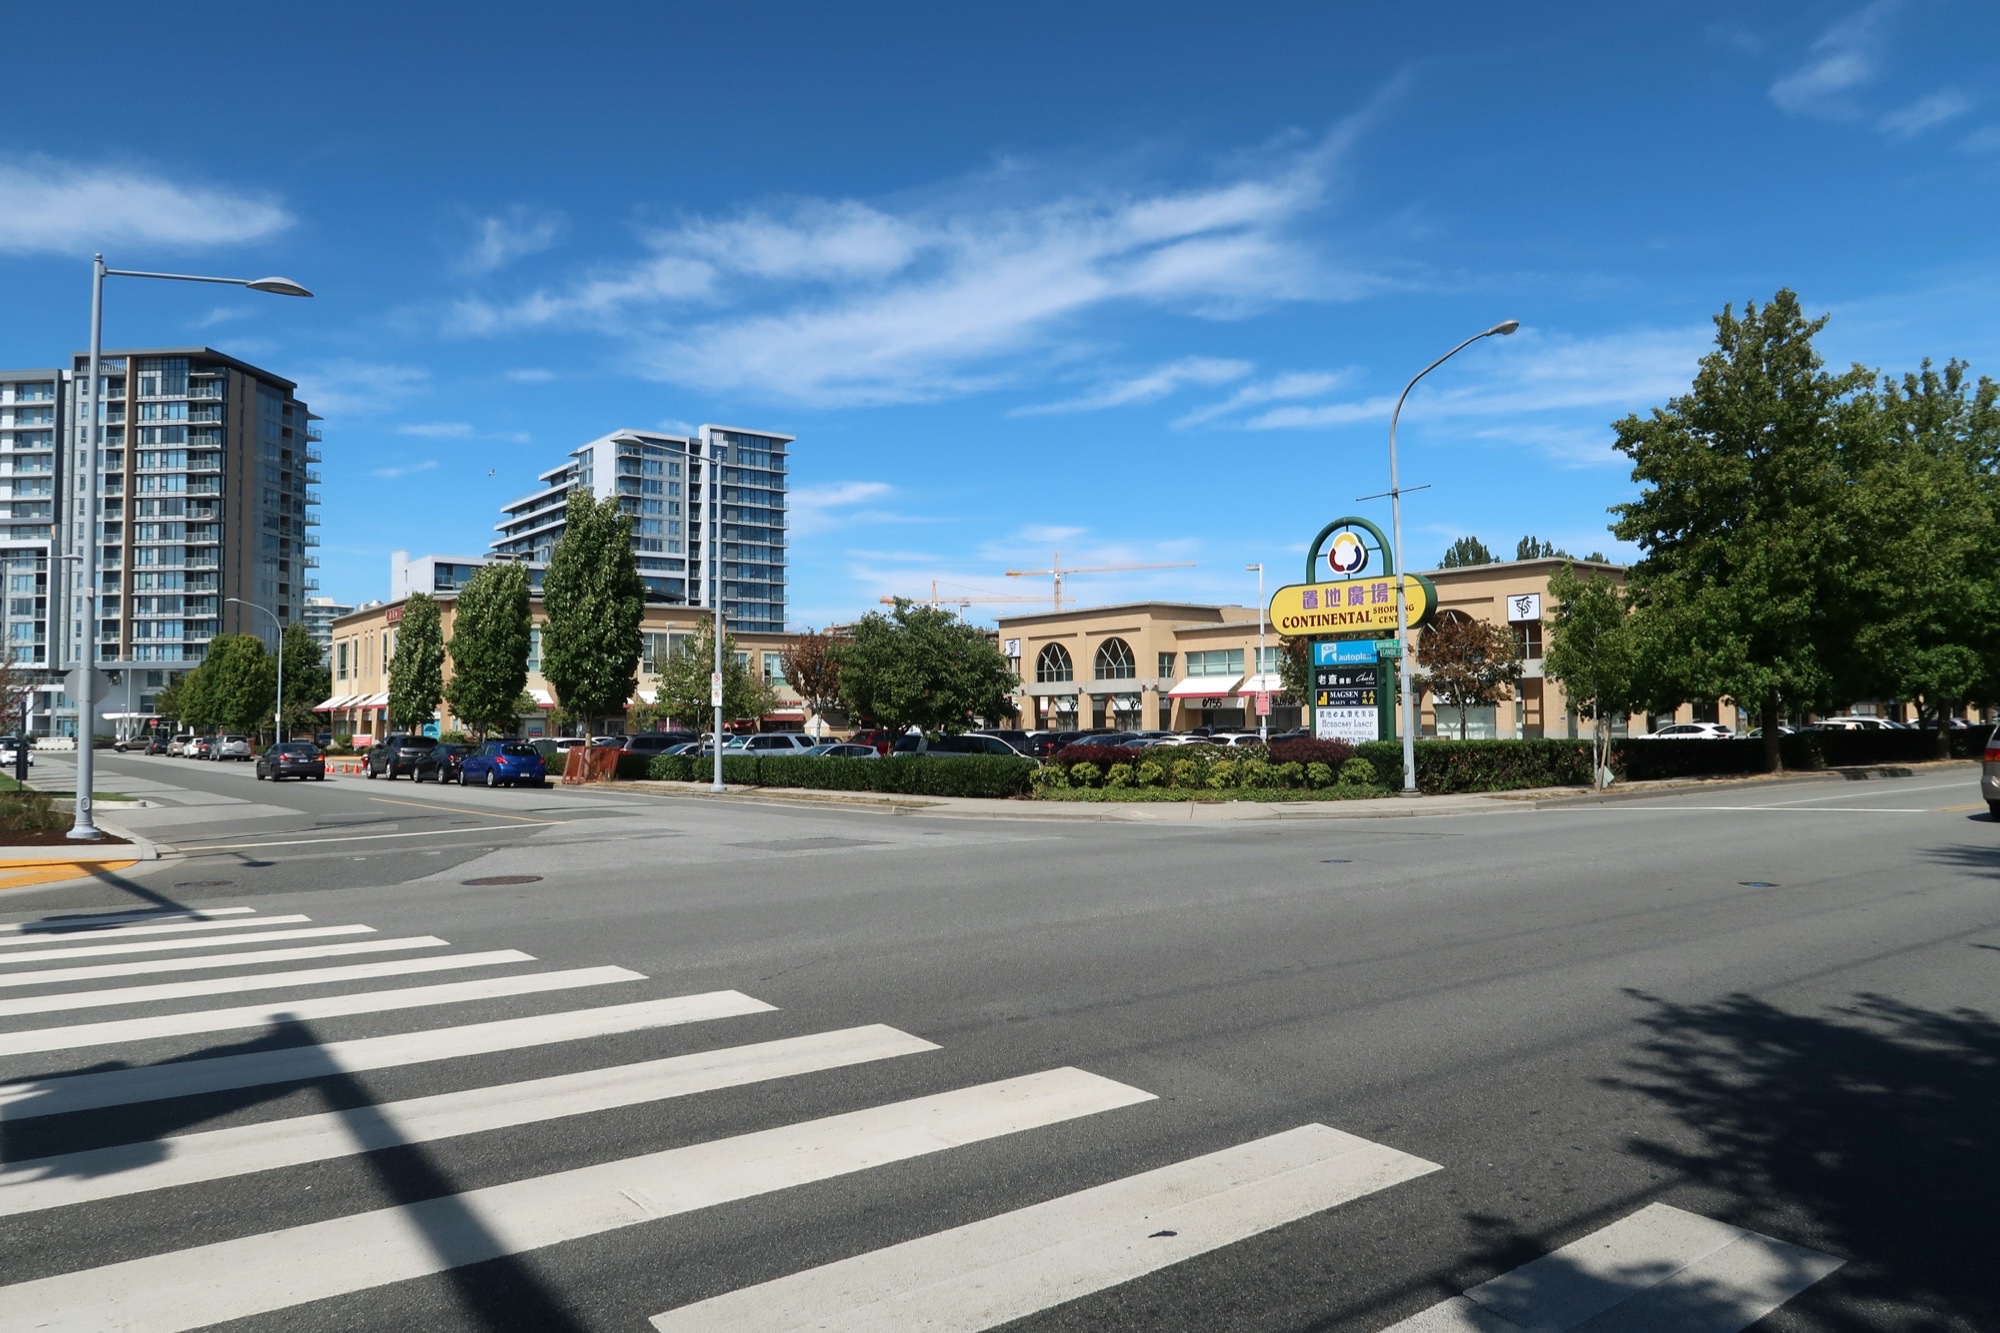
The population behind those deciles is large and concentrated. Chinese populations numbered about 1.7 million in 2021, 4.7% of Canada, and more than doubled from 1996. Projections put the group at roughly 2.6 million to 3.5 million by 2041. Nearly all lived in census metropolitan areas, and more than two-thirds lived in Toronto (39.6%) or Vancouver (29.9%). Chinese residents were a majority in Richmond, B.C. (54.3%) and nearly half of Markham, Ont. (47.9%).
Place of birth is the first ledger split families should make. Nearly half (47.8%) were born in China as defined without Hong Kong or Macao, 28.4% in Canada, 12.8% in Hong Kong, and about 4% each in Taiwan and Southeast Asia. Immigrants admitted from 1970 to 1996 were often from Hong Kong, Taiwan, or Southeast Asia. From 1998 to 2021, 86.8% of Chinese immigrants living in Canada in 2021 had been born in China. Mandarin mother-tongue arrivals from China clustered after 2000; Cantonese Hong Kong arrivals clustered around the 1987 to 1997 handover years.
Admission class matters too. Among Chinese people who immigrated from 1980 to 2021 and still lived in Canada in 2021, 64.9% were economic immigrants and 28.7% were family-sponsored. Among those born in Southeast Asia, one-quarter were refugees, a line that traces back to the late-1970s and 1980 Southeast Asian refugee arrivals. A points-selected engineer, a sponsored parent, and a refugee family do not arrive with the same Canadian credit file or the same property story abroad.
Education looks strong until you ask about job match. Among Chinese people aged 25 to 54, 61.8% held a bachelor’s degree or higher in 2021, yet they had lower employment rates and higher unemployment rates than the non-racialized non-Indigenous population across education levels. Among degree holders who worked in 2020 or 2021, 57.4% of Chinese people worked as professionals or as senior or specialized managers, versus 65.7% for the comparison group. The gap widened for degrees earned outside Canada, especially for women.
Income numbers explain why median talk misleads dinner-table comparisons. Median adjusted after-tax economic family income for Chinese people in 2020 was $49,600, about 92.5% of the non-racialized non-Indigenous median of $53,600. In the distribution, Chinese people were overrepresented at the bottom and the top, and thinner in the middle. Bottom-decile incomes were more common among people born in China (22.0%), Taiwan (19.9%), or Hong Kong (14.9%) than among Canadian-born Chinese people (7.8%). Top-decile incomes were more common among Canadian-born Chinese people (16.8%) and those born in Hong Kong (15.0%) than among those born in China (8.0%).
Housing looks like success until the payment share shows up. Chinese people had the highest homeownership rate of any population group in the portrait, at 84.5%, and 31.8% lived in mortgage-free owner households. Among Chinese people with a mortgage and at least $2,500 in adjusted after-tax family income, 40.6% spent 30% or more of household income on housing, versus 12.4% for the non-racialized non-Indigenous population. Those 2021 Census figures landed before the 2022 and 2023 rate rises, so they likely understate today’s squeeze.
Newer poverty data keeps the caution live. The Canadian Income Survey for 2024 put the poverty rate for Chinese Canadians at 19.0%, above South Asian Canadians (14.2%), Black Canadians (16.4%), racialized groups overall (15.5%), and non-racialized people (8.9%). High education and high ownership rates can coexist with Market Basket Measure hardship when earnings, housing costs, and recent arrival timing do not line up.
Discrimination and belonging sit beside the money file. In the 2020 General Social Survey on Social Identity, 61.4% of Chinese people reported discrimination in the pandemic window or the five years before it, and 40.9% reported discrimination during the pandemic, the highest share among racialized groups in that comparison. Only 20.3% reported a very strong sense of belonging to their local community. History is not abstract here: head taxes, the 1923 Chinese Immigration Act that nearly banned Chinese entry until 1947, and later points-based selection all shaped who could build equity in Canada and when.
StatCan itself flags a wealth gap in the data: the portrait measures income and housing, not net worth, which matters for households with low reported income but paid-off property or savings abroad. For diaspora readers in Canada, or for U.S. siblings supporting parents in Richmond or Markham, the practical move is to stop treating Chinese Canadian averages as a family report card. Separate the ledgers by place of birth, credential location, mortgage stress, remittances, and property in China or Hong Kong before you argue about who is doing fine.
If your household spans Canada and another country, start with U.S.-Canada Dual-Life Family Money Basics and Cross-Border Family Wealth and Paperwork Basics. Keep China-corridor support visible with Send Money to China From the U.S., the Remittance Fee Comparator, and the Family Support Budget Calculator.
Related content
Generational Take
Get the next Generational Take
Get our latest practical tips and takes in your inbox. No spam.